Spike-triggered average
The spike-triggered average (STA) is a tool for characterizing the response properties of a neuron using the spikes emitted in response to a time-varying stimulus. The STA provides an estimate of a neuron's linear receptive field. It is a useful technique for the analysis of electrophysiological data.
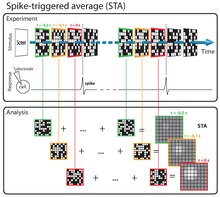
Mathematically, the STA is the average stimulus preceding a spike.[1][2][3][4] To compute the STA, the stimulus in the time window preceding each spike is extracted, and the resulting (spike-triggered) stimuli are averaged (see diagram). The STA provides an unbiased estimate of a neuron's receptive field only if the stimulus distribution is spherically symmetric (e.g., Gaussian white noise).[3][5][6]
The STA has been used to characterize retinal ganglion cells,[7][8] neurons in the lateral geniculate nucleus and simple cells in the striate cortex (V1) .[9][10] It can be used to estimate the linear stage of the linear-nonlinear-Poisson (LNP) cascade model.[4]
Spike-triggered averaging is also commonly referred to as “reverse correlation″ or “white-noise analysis”. The STA is well known as the first term in the Volterra kernel or Wiener kernel series expansion.[11] It is closely related to linear regression, and identical to it in common circumstances.
Contents
Mathematical Definition[edit]
Standard STA[edit]
Let denote the spatio-temporal stimulus vector preceding the 'th time bin, and the spike count in that bin. The stimuli can be assumed to have zero mean (i.e., ). If not, it can be transformed to have zero-mean by subtracting the mean stimulus from each vector. The STA is given


![E[{\mathbf {x}}]=0](https://wikimedia.org/api/rest_v1/media/math/render/svg/a70804d73eb81b237c4815ee98b13be7306006f0)

where , the total number of spikes.

This equation is more easily expressed in matrix notation: let denote a matrix whose 'th row is the stimulus vector and let denote a column vector whose th element is . Then the STA can be written


Whitened STA[edit]
If the stimulus is not white noise, but instead has non-zero correlation across space or time, the standard STA provides a biased estimate of the linear receptive field.[5] It may therefore be appropriate to whiten the STA by the inverse of the stimulus covariance matrix. The resulting estimator is known as the whitened STA, which is given by

where the first term is the inverse covariance matrix of the raw stimuli and the second is the standard STA. In matrix notation, this can be written

The whitened STA is unbiased only if the stimulus distribution can be described by a correlated Gaussian distribution [6] (correlated Gaussian distributions are elliptically symmetric, i.e. can be made spherically symmetric by a linear transformation, but not all elliptically symmetric distributions are Gaussian). This is a weaker condition than spherical symmetry.
The whitened STA is equivalent to linear least-squares regression of the stimulus against the spike train.
Regularized STA[edit]
In practice, it may be necessary to regularize the whitened STA, since whitening amplifies noise along stimulus dimensions that are poorly explored by the stimulus (i.e., axes along which the stimulus has low variance). A common approach to this problem is ridge regression. The regularized STA, computed using ridge regression, can be written

where denotes the identity matrix and is the ridge parameter controlling the amount of regularization. This procedure has a simple Bayesian interpretation: ridge regression is equivalent to placing a prior on the STA elements that says they are drawn i.i.d. from a zero-mean Gaussian prior with covariance proportional to the identity matrix. The ridge parameter sets the inverse variance of this prior, and is usually fit by cross-validation or empirical Bayes.


Statistical Properties[edit]
For responses generated according to an LNP model, the whitened STA provides an estimate of the subspace spanned by the linear receptive field. The properties of this estimate are as follows
Consistency[edit]
The whitened STA is a consistent estimator, i.e., it converges to the true linear subspace, if
- The stimulus distribution is elliptically symmetric, e.g., Gaussian. (Bussgang's theorem)
- The expected STA is not zero, i.e., nonlinearity induces a shift in the spike-triggered stimuli.[5]

Optimality[edit]
The whitened STA is an asymptotically efficient estimator if
- The stimulus distribution is Gaussian
- The neuron's nonlinear response function is the exponential, .[5]

For arbitrary stimuli, the STA is generally not consistent or efficient. For such cases, maximum likelihood and information-based estimators [5][6][12] have been developed that are both consistent and efficient.
See also[edit]
References[edit]
- ^ de Boer and Kuyper (1968) Triggered Correlation. IEEE Transact. Biomed. Eng., 15:169-179
- ^ Marmarelis, P. Z. and Naka, K. (1972). White-noise analysis of a neuron chain: an application of the Wiener theory. Science, 175:1276-1278
- ^ a b Chichilnisky, E. J. (2001). A simple white noise analysis of neuronal light responses. Network: Computation in Neural Systems, 12:199-213
- ^ a b Simoncelli, E. P., Paninski, L., Pillow, J. & Swartz, O. (2004). "Characterization of neural responses with stochastic stimuli". In M. Gazzaniga (Ed.) The Cognitive Neurosciences, III (pp. 327-338). MIT press.
- ^ a b c d e Paninski, L. (2003). Convergence properties of some spike-triggered analysis techniques. Network: Computation in Neural Systems 14:437-464
- ^ a b c Sharpee, T.O., Rust, N.C., & Bialek, W. (2004). Analyzing neural responses to natural signals: Maximally informative dimensions. Neural Computation 16:223-250
- ^ Sakai and Naka (1987).
- ^ Meister, Pine, and Baylor (1994).
- ^ Jones and Palmer (1987).
- ^ McLean and Palmer (1989).
- ^ Lee and Schetzen (1965). Measurement of the Wiener kernels of a non- linear system by cross-correlation. International Journal of Control, First Series, 2:237-254
- ^ Kouh M. & Sharpee, T.O. (2009). Estimating linear-nonlinear models using Rényi divergences, Network: Computation in Neural Systems 20(2): 49–68