DBSCAN
| Machine learning and data mining |
|---|
 |
|
Machine-learning venues |
Density-based spatial clustering of applications with noise (DBSCAN) is a data clustering algorithm proposed by Martin Ester, Hans-Peter Kriegel, Jörg Sander and Xiaowei Xu in 1996.[1] It is a density-based clustering algorithm: given a set of points in some space, it groups together points that are closely packed together (points with many nearby neighbors), marking as outliers points that lie alone in low-density regions (whose nearest neighbors are too far away). DBSCAN is one of the most common clustering algorithms and also most cited in scientific literature.[2]
In 2014, the algorithm was awarded the test of time award (an award given to algorithms which have received substantial attention in theory and practice) at the leading data mining conference, KDD.[3]
Contents
History[edit]
In 1972, Robert F. Ling published "The Theory and Construction of k-Clusters"[4] in The Computer Journal with a closely related, with an estimated runtime complexity of O(n³).[4] DBSCAN has a worst-case of O(n²), and the database-oriented range-query formulation of DBSCAN allows for index acceleration. The algorithms differ in their handling of border points.
Preliminary[edit]
Consider a set of points in some space to be clustered. Let ε be a parameter specifying the radius of a neighborhood with respect to some point. For the purpose of DBSCAN clustering, the points are classified as core points, (density-)reachable points and outliers, as follows:
- A point p is a core point if at least minPts points are within distance ε of it (including p).
- A point q is directly reachable from p if point q is within distance ε from core point p. Points are only said to be directly reachable from core points.
- A point q is reachable from p if there is a path p1, ..., pn with p1 = p and pn = q, where each pi+1 is directly reachable from pi. Note that this implies that all points on the path must be core points, with the possible exception of q.
- All points not reachable from any other point are outliers or noise points.
Now if p is a core point, then it forms a cluster together with all points (core or non-core) that are reachable from it. Each cluster contains at least one core point; non-core points can be part of a cluster, but they form its "edge", since they cannot be used to reach more points.

Reachability is not a symmetric relation since, by definition, no point may be reachable from a non-core point, regardless of distance (so a non-core point may be reachable, but nothing can be reached from it). Therefore, a further notion of connectedness is needed to formally define the extent of the clusters found by DBSCAN. Two points p and q are density-connected if there is a point o such that both p and q are reachable from o. Density-connectedness is symmetric.
A cluster then satisfies two properties:
- All points within the cluster are mutually density-connected.
- If a point is density-reachable from any point of the cluster, it is part of the cluster as well.
Algorithm[edit]
Original Query-based Algorithm[edit]
DBSCAN requires two parameters: ε (eps) and the minimum number of points required to form a dense region[a] (minPts). It starts with an arbitrary starting point that has not been visited. This point's ε-neighborhood is retrieved, and if it contains sufficiently many points, a cluster is started. Otherwise, the point is labeled as noise. Note that this point might later be found in a sufficiently sized ε-environment of a different point and hence be made part of a cluster.
If a point is found to be a dense part of a cluster, its ε-neighborhood is also part of that cluster. Hence, all points that are found within the ε-neighborhood are added, as is their own ε-neighborhood when they are also dense. This process continues until the density-connected cluster is completely found. Then, a new unvisited point is retrieved and processed, leading to the discovery of a further cluster or noise.
DBSCAN can be used with any distance function[1][5] (as well as similarity functions or other predicates).[6] The distance function (dist) can therefore be seen as an additional parameter.
The algorithm can be expressed in pseudocode as follows:[5]
DBSCAN(DB, distFunc, eps, minPts) {
   C = 0                                                  /* Cluster counter */
   for each point P in database DB {
      if label(P) ≠ undefined then continue               /* Previously processed in inner loop */
      Neighbors N = RangeQuery(DB, distFunc, P, eps)      /* Find neighbors */
      if |N| < minPts then {                              /* Density check */
         label(P) = Noise                                 /* Label as Noise */
         continue
      }
      C = C + 1                                           /* next cluster label */
      label(P) = C                                        /* Label initial point */
      Seed set S = N \ {P}                                /* Neighbors to expand */
      for each point Q in S {                             /* Process every seed point */
         if label(Q) = Noise then label(Q) = C            /* Change Noise to border point */
         if label(Q) ≠ undefined then continue            /* Previously processed */
         label(Q) = C                                     /* Label neighbor */
         Neighbors N = RangeQuery(DB, distFunc, Q, eps)   /* Find neighbors */
         if |N| ≥ minPts then {                           /* Density check */
            S = S ∪ N                                     /* Add new neighbors to seed set */
         }
      }
   }
}
where RangeQuery can be implemented using a database index for better performance, or using a slow linear scan:
RangeQuery(DB, distFunc, Q, eps) {
   Neighbors = empty list
   for each point P in database DB {                      /* Scan all points in the database */
      if distFunc(Q, P) ≤ eps then {                      /* Compute distance and check epsilon */
         Neighbors = Neighbors ∪ {P}                      /* Add to result */
      }
   }
   return Neighbors
}
Abstract Algorithm[edit]
The DBSCAN algorithm can be abstracted into the following steps:[5]
- Find the points in the ε (eps) neighborhood of every point, and identify the core points with more than minPts neighbors.
- Find the connected components of core points on the neighbor graph, ignoring all non-core points.
- Assign each non-core point to a nearby cluster if the cluster is an ε (eps) neighbor, otherwise assign it to noise.
A naive implementation of this requires storing the neighborhoods in step 1, thus requiring substantial memory. The original DBSCAN algorithm does not require this by performing these steps for one point at a time.
Complexity[edit]
DBSCAN visits each point of the database, possibly multiple times (e.g., as candidates to different clusters). For practical considerations, however, the time complexity is mostly governed by the number of regionQuery invocations. DBSCAN executes exactly one such query for each point, and if an indexing structure is used that executes a neighborhood query in O(log n), an overall average runtime complexity of O(n log n) is obtained (if parameter ε is chosen in a meaningful way, i.e. such that on average only O(log n) points are returned). Without the use of an accelerating index structure, or on degenerated data (e.g. all points within a distance less than ε), the worst case run time complexity remains O(n²). The distance matrix of size (n²-n)/2 can be materialized to avoid distance recomputations, but this needs O(n²) memory, whereas a non-matrix based implementation of DBSCAN only needs O(n) memory.

Advantages[edit]
- DBSCAN does not require one to specify the number of clusters in the data a priori, as opposed to k-means.
- DBSCAN can find arbitrarily shaped clusters. It can even find a cluster completely surrounded by (but not connected to) a different cluster. Due to the MinPts parameter, the so-called single-link effect (different clusters being connected by a thin line of points) is reduced.
- DBSCAN has a notion of noise, and is robust to outliers.
- DBSCAN requires just two parameters and is mostly insensitive to the ordering of the points in the database. (However, points sitting on the edge of two different clusters might swap cluster membership if the ordering of the points is changed, and the cluster assignment is unique only up to isomorphism.)
- DBSCAN is designed for use with databases that can accelerate region queries, e.g. using an R* tree.
- The parameters minPts and ε can be set by a domain expert, if the data is well understood.
Disadvantages[edit]
- DBSCAN is not entirely deterministic: border points that are reachable from more than one cluster can be part of either cluster, depending on the order the data are processed. For most data sets and domains, this situation does not arise often and has little impact on the clustering result:[5] both on core points and noise points, DBSCAN is deterministic. DBSCAN*[7] is a variation that treats border points as noise, and this way achieves a fully deterministic result as well as a more consistent statistical interpretation of density-connected components.
- The quality of DBSCAN depends on the distance measure used in the function regionQuery(P,ε). The most common distance metric used is Euclidean distance. Especially for high-dimensional data, this metric can be rendered almost useless due to the so-called "Curse of dimensionality", making it difficult to find an appropriate value for ε. This effect, however, is also present in any other algorithm based on Euclidean distance.
- DBSCAN cannot cluster data sets well with large differences in densities, since the minPts-ε combination cannot then be chosen appropriately for all clusters.[8]
- If the data and scale are not well understood, choosing a meaningful distance threshold ε can be difficult.
See the section below on extensions for algorithmic modifications to handle these issues.
Parameter estimation[edit]
Every data mining task has the problem of parameters. Every parameter influences the algorithm in specific ways. For DBSCAN, the parameters ε and minPts are needed. The parameters must be specified by the user. Ideally, the value of ε is given by the problem to solve (e.g. a physical distance), and minPts is then the desired minimum cluster size.[a]
- MinPts: As a rule of thumb, a minimum minPts can be derived from the number of dimensions D in the data set, as minPts ≥ D + 1. The low value of minPts = 1 does not make sense, as then every point on its own will already be a cluster. With minPts ≤ 2, the result will be the same as of hierarchical clustering with the single link metric, with the dendrogram cut at height ε. Therefore, minPts must be chosen at least 3. However, larger values are usually better for data sets with noise and will yield more significant clusters. As a rule of thumb, minPts = 2·dim can be used,[6] but it may be necessary to choose larger values for very large data, for noisy data or for data that contains many duplicates.[5]
- ε: The value for ε can then be chosen by using a k-distance graph, plotting the distance to the k = minPts-1 nearest neighbor ordered from the largest to the smallest value.[5] Good values of ε are where this plot shows an "elbow":[1][6][5] if ε is chosen much too small, a large part of the data will not be clustered; whereas for a too high value of ε, clusters will merge and the majority of objects will be in the same cluster. In general, small values of ε are preferable,[5] and as a rule of thumb only a small fraction of points should be within this distance of each other. Alternatively, an OPTICS plot can be used to choose ε,[5] but then the OPTICS algorithm itself can be used to cluster the data.
- Distance function: The choice of distance function is tightly coupled to the choice of ε, and has a major impact on the results. In general, it will be necessary to first identify a reasonable measure of similarity for the data set, before the parameter ε can be chosen. There is no estimation for this parameter, but the distance functions needs to be chosen appropriately for the data set. For example, on geographic data, the great-circle distance is often a good choice.
OPTICS can be seen as a generalization of DBSCAN that replaces the ε parameter with a maximum value that mostly affects performance. MinPts then essentially becomes the minimum cluster size to find. While the algorithm is much easier to parameterize than DBSCAN, the results are a bit more difficult to use, as it will usually produce a hierarchical clustering instead of the simple data partitioning that DBSCAN produces.
Recently, one of the original authors of DBSCAN has revisited DBSCAN and OPTICS, and published a refined version of hierarchical DBSCAN (HDBSCAN*),[7] which no longer has the notion of border points. Instead, only the core points form the cluster.
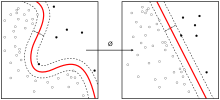
Relationship to spectral clustering[edit]
DBSCAN can be seen as special (efficient) variant of spectral clustering: Connected components correspond to optimal spectral clusters (no edges cut – spectral clustering tries to partition the data with a minimum cut); DBSCAN finds connected components on the (asymmetric!) reachability graph.[9] However, spectral clustering can be computationally intensive (up to without approximation and further assumptions), and one has to choose the number of clusters for both the number of eigenvectors to choose and the number of clusters to produce with k-means on the spectral embedding. Thus, for performance reasons, the original DBSCAN algorithm remains preferable to a spectral implementation, and this relationship is so far only of theoretical interest.


Extensions[edit]
Generalized DBSCAN (GDBSCAN)[6][10] is a generalization by the same authors to arbitrary "neighborhood" and "dense" predicates. The ε and minpts parameters are removed from the original algorithm and moved to the predicates. For example, on polygon data, the "neighborhood" could be any intersecting polygon, whereas the density predicate uses the polygon areas instead of just the object count.
Various extensions to the DBSCAN algorithm have been proposed, including methods for parallelization, parameter estimation, and support for uncertain data. The basic idea has been extended to hierarchical clustering by the OPTICS algorithm. DBSCAN is also used as part of subspace clustering algorithms like PreDeCon and SUBCLU. HDBSCAN[7] is a hierarchical version of DBSCAN which is also faster than OPTICS, from which a flat partition consisting of the most prominent clusters can be extracted from the hierarchy.[11]
Availability[edit]
Different implementations of the same algorithm were found to exhibit enormous performance differences, with the fastest on a test data set finishing in 1.4 seconds, the slowest taking 13803 seconds.[12] The differences can be attributed to implementation quality, language and compiler differences, and the use of indexes for acceleration.
- Apache Commons Math contains a Java implementation of the algorithm running in quadratic time.
- ELKI offers an implementation of DBSCAN as well as GDBSCAN and other variants. This implementation can use various index structures for sub-quadratic runtime and supports arbitrary distance functions and arbitrary data types, but it may be outperformed by low-level optimized (and specialized) implementations on small data sets.
- PostGIS includes ST_ClusterDBSCAN – a 2D implementation of DBSCAN that uses R-tree index. Any geometry type is supported, e.g. Point, LineString, Polygon, etc.
- R contains DBSCAN in the fpc package with support for arbitrary distance functions via distance matrices. However it does not have index support (and thus has quadratic runtime and memory complexity) and is rather slow due to the R interpreter. A faster version is implemented in C++ using k-d trees (for Euclidean distance only) in the R package dbscan.
- scikit-learn includes a Python implementation of DBSCAN for arbitrary Minkowski metrics, which can be accelerated using k-d trees and ball trees but which uses worst-case quadratic memory. A contribution to scikit-learn provides an implementation of the HDBSCAN* algorithm.
- pyclustering library includes a Python and C++ implementation of DBSCAN for Euclidean distance only as well as OPTICS algorithm.
- SPMF includes an implementation of the DBSCAN algorithm with k-d tree support for Euclidean distance only.
- Weka contains (as an optional package in latest versions) a basic implementation of DBSCAN that runs in quadratic time and linear memory.
Notes[edit]
- ^ a b While minPts intuitively is the minimum cluster size, in some cases DBSCAN can produce smaller clusters.[5] A DBSCAN cluster consists of at least one core point.[5] As other points may be border points to more than one cluster, there is no guarantee that at least minPts points are included in every cluster.
References[edit]
- ^ a b c Ester, Martin; Kriegel, Hans-Peter; Sander, Jörg; Xu, Xiaowei (1996). Simoudis, Evangelos; Han, Jiawei; Fayyad, Usama M., eds. A density-based algorithm for discovering clusters in large spatial databases with noise. Proceedings of the Second International Conference on Knowledge Discovery and Data Mining (KDD-96). AAAI Press. pp. 226–231. CiteSeerX 10.1.1.121.9220. ISBN 1-57735-004-9.
- ^ "Archived copy". Archived from the original on April 21, 2010. Retrieved 2010-04-18.CS1 maint: Archived copy as title (link) Most cited data mining articles according to Microsoft academic search; DBSCAN is on rank 24.
- ^ "2014 SIGKDD Test of Time Award". ACM SIGKDD. 2014-08-18. Retrieved 2016-07-27.
- ^ a b Ling, R. F. (1972-01-01). "On the theory and construction of k-clusters". The Computer Journal. 15 (4): 326–332. doi:10.1093/comjnl/15.4.326. ISSN 0010-4620.
- ^ a b c d e f g h i j k Schubert, Erich; Sander, Jörg; Ester, Martin; Kriegel, Hans Peter; Xu, Xiaowei (July 2017). "DBSCAN Revisited, Revisited: Why and How You Should (Still) Use DBSCAN". ACM Trans. Database Syst. 42 (3): 19:1–19:21. doi:10.1145/3068335. ISSN 0362-5915.
- ^ a b c d Sander, Jörg; Ester, Martin; Kriegel, Hans-Peter; Xu, Xiaowei (1998). "Density-Based Clustering in Spatial Databases: The Algorithm GDBSCAN and Its Applications". Data Mining and Knowledge Discovery. Berlin: Springer-Verlag. 2 (2): 169–194. doi:10.1023/A:1009745219419.
- ^ a b c Campello, Ricardo J. G. B.; Moulavi, Davoud; Zimek, Arthur; Sander, Jörg (2015). "Hierarchical Density Estimates for Data Clustering, Visualization, and Outlier Detection". ACM Transactions on Knowledge Discovery from Data. 10 (1): 1–51. doi:10.1145/2733381. ISSN 1556-4681.
- ^ Kriegel, Hans-Peter; Kröger, Peer; Sander, Jörg; Zimek, Arthur (2011). "Density-based Clustering". WIREs Data Mining and Knowledge Discovery. 1 (3): 231–240. doi:10.1002/widm.30.
- ^ Schubert, Erich; Hess, Sibylle; Morik, Katharina (2018). The Relationship of DBSCAN to Matrix Factorization and Spectral Clustering (PDF). LWDA. pp. 330–334.
- ^ Sander, Jörg (1998). Generalized Density-Based Clustering for Spatial Data Mining. München: Herbert Utz Verlag. ISBN 3-89675-469-6.
- ^ Campello, R. J. G. B.; Moulavi, D.; Zimek, A.; Sander, J. (2013). "A framework for semi-supervised and unsupervised optimal extraction of clusters from hierarchies". Data Mining and Knowledge Discovery. 27 (3): 344. doi:10.1007/s10618-013-0311-4.
- ^ Kriegel, Hans-Peter; Schubert, Erich; Zimek, Arthur (2016). "The (black) art of runtime evaluation: Are we comparing algorithms or implementations?". Knowledge and Information Systems. 52 (2): 341. doi:10.1007/s10115-016-1004-2. ISSN 0219-1377.